5 Flowchart Basics and Rules all Beginners Should Follow

Flowcharts can be intimidating to novices. There are all these unique symbols that you probably don’t understand. It doesn’t matter if you are trying to make one from scratch or read a flowchart – it may seem like mission impossible. Like other things, this couldn’t be farther from the truth.
Yes, it may take you some time to get to know all the ins and outs of this tool. However, it can provide you with so many benefits that you will wonder who you could have done anything without it so far. In this article, we will tell you about some essential things you need to know and provide you with tips on creating your first diagram.
What is a flowchart?

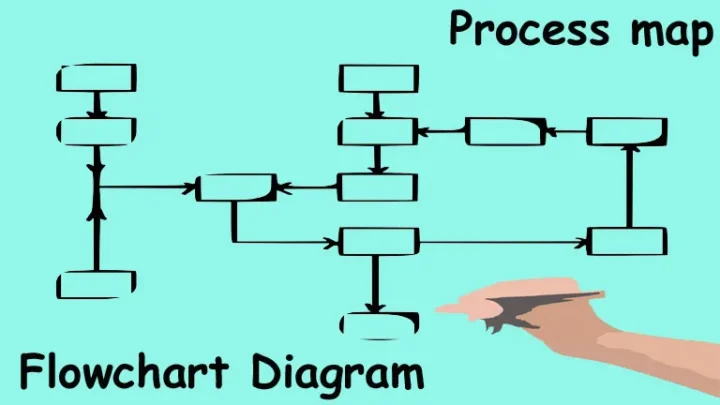
First thing first, let us answer this question. In a nutshell, it is a visual representation of a process. Even though it was originally used in the field of computer science, nowadays, it is a vital tool in several industries. You can use it to display any aspect of your company, from the manufacturing process to strategies to grow your business. When it comes to the latter, it enables you to break down every part of the process, observe all the detail, and predict problems that may occur in the future.
Learn the symbols
As already mentioned, these can be a bit intimidating since people are usually only familiar with the ones that depict decisions and processes. So, when they see the other ones for the first time, they get confused. These two symbols come in the shape of a diamond and rectangle, respectively. Then there is the oval one called the terminator, and as you can assume, it depicts the start and the end of the process.
Furthermore, the document symbol is a crucial one because it can either stand for reports or emails you need to go through to continue the process, or on the other hand, it can tell you that it is the moment to fill out the invoices or write reports. There are also on-page and off-page reference symbols, the flow line, etc. Before you start making the diagram, you need to get familiar with all these flowchart rules, and you can learn some additional ones on the Zenflowchart website.
When to use the flowchart?

This is the most common question people have because, after all, it can prove to be essential in some instances and utterly useless in others. The first thing that probably comes to your mind is that it can be beneficial when trying to understand a complex process. Yes, this is the most common application of this tool. It doesn’t matter if you are faced with a problem that cannot be easily analyzed or if you are trying to improve the manufacturing process or a strategy you currently use.
This diagram enables you to simply identify all the steps that need to be taken to reach the goal. At the same time, it can also help you understand if there are some steps that may be completely unnecessary and that would be a waste of your time. In addition, it is a great way to get your employees familiar with what you are working on and how they can contribute to it. Upon reading this, it goes without saying that it can also prove to be critical when coming up with new strategies.
The most common types of flowchart

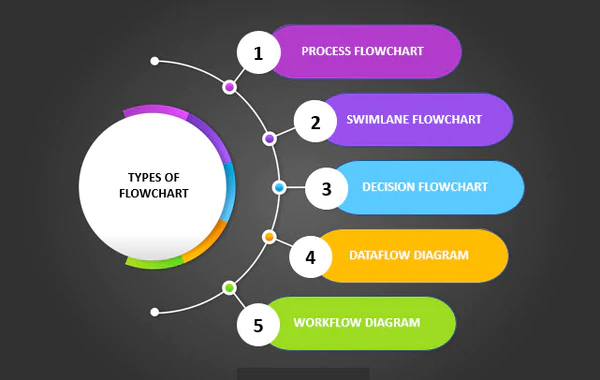
If you are still unsure when it is the best time to employ this diagram, here is a short description of the most popular ones. Firstly, there is the process flowchart, which we mentioned a few times now. Basically, it enables you to depict every step of a specific process, describe it, list essential things for it to be concluded successfully, explain everything to your employees in great detail. Due to these features and benefits, it can be used for pretty much anything.
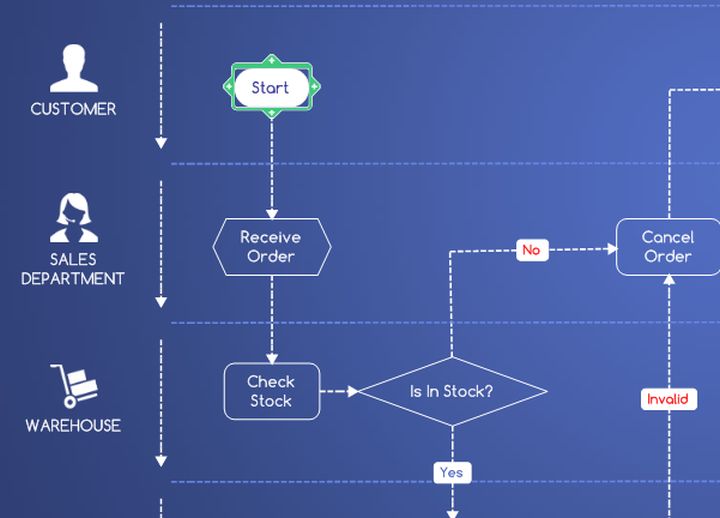
Furthermore, a workflow diagram visually displays how your business works. It can be an excellent tool for training new people, finding potential issues that can be prevented, presenting them to the team, etc. The swimlane flowchart is a bit more complex, since it enables you to show how two processes work simultaneously. For example, it can depict how two separate departments in your company work. It may seem to be similar to the previously described one, but the main difference is that this one allows you to include more categories. Lastly, the data flowchart is used to analyze how information moves through your company and how it is evaluated.
How to make a flowchart?

Finally, before we conclude this article, we have to give you some tips on designing this diagram. First things first, you need to understand its purpose. Why do you need one? The answer to this question will facilitate the entire process, and you can take it a step further by choosing one of the templates, or, on the other hand, you can create one from scratch.
The next step is to include symbols. These are the vital part of every flowchart, so you first need to get familiar with them to understand which ones you should use. You should also be consistent with these, meaning that they should all be of the same size. Yes, you can boost the overall design by including colors, but make sure that you assign a specific purpose to each of them.
Next, make sure to work from left to right. This is a golden rule when designing one of these. The starting point should always be on the left, and the ending one should be on the right side of the paper or screen. Once you have all the fields, do not forget to connect them with lines or arrows, whichever works for the best. If you are not sure which action is the best one, you can add your options and use the split path. This way, all the steps and potential outcomes will be clearly displayed, and it will be easy for you to decide which ones you should choose. If you want to boost the overall appearance of the flowchart, you can change the background, add the header, or use any of the numerous additional features top-notch apps offer.

